Document Status: Final
CASA Equity Analysis
Identify the geographic impacts of the CASA Compact as adopted by the CASA Technical Committee on December 3, modified before appproval by the CASA Steering Committee on December 12, and authorized for Commission Chair signiature by the Metropolitan Transportation Commission (MTC) on December 19, 2018.
Project Management
Contents
Data Sources
- U.S. Census - American Community Survey 2012-2016
- U.S. Census - TIGER/Line Shapefiles 2016
- MTC Communities of Concern (2018)
- BCDC Disadvantaged Communities
- ABAG Housing Policy Database
- UC Berkeley UDP Displacement Typologies
- TCAC/HCD Opportunity Areas
Analysis Parameters
Sensitive Communities
Sensitive Communities are definined as urbanized census tracts that are classified as both MTC Communities of Concern and Disadvantaged Communities of the Bay Conservation and Development Commission (BCDC). To explore MTC’s definition of Communities of Concern, please see the Communities of Concern project documentation page. To explore BCDC’s definition, please see the BCDC Community Indicators User Guide.
Parcels Zoned for Housing
The Equity Analysis uses Bay Area Metro’s existing regionwide general plan land use data. To explore the database, please see the Plan Land Use project documentation page. For the equity analysis, single-family parcels are those classified as HS (single family residential), multi-family parcels are those classified as HT (townhomes) or HM (multi family residential), and mixed-use parcels are those classified as MR (mixed use residential focused).
Rent Increases, 2011 to 2016
Rent is defined by American Community Survey variable B25064-001E, which refers to median gross rent (dollars) per census tract in renter-occupied housing units paying cash rent. Rent increases are measured by the percent change in this variable between the 2011 and 2016 ACS.
Low Income Renters
The Equity Analysis looks at the spatial distribution of low income renters paying at least 30% and 50% of their income on rent and low income minority renters paying at least 30% and 50% of their income on rent. Data on low income renters comes from the American Community Survey’s Public Use Microdata Sample (PUMS) data. The table below provides the written and variable definitions for the terms in this section. To get variable definitions, please refer to the 2012-2016 ACS 5-year PUMS Data Dictionary.
| Term | Written definition | Variable definition |
|---|---|---|
| Low Income | Household income < 200% Federal Poverty Level (FPL) | POVPIP>=0, <200 |
| Renter | Self-explanatory | TEN=3 |
| Minority | Not non-Hispanic/Latino White | All except HISP=1 AND RAC1P=1 |
| Paying Greater than 30% of Income on Housing | Self-explanatory | GRPIP>=30 |
| Paying Greater than 50% of Income on Housing | Self-explanatory | GRPIP>=50 |
Jurisdictions with Tenant Protections
Jurisdiction housing policies come from the Association of Bay Area Governments’ Housing Policy Database. Please note that the data in the Equity Analysis has caveats due to discrepancies between the user-friendly interface and the underlying dataset in addition to the dataset becoming partially out of date. These issues have since been resolved on the ABAG website, but they have not been addressed in the public version of the equity analysis:
- Mountain View CDP is listed as having both rent stabilization and just cause policies, but CDPs have no authority to enact such policies. The City of Mountain View has both, but the interface says the City of Mountain View has neither. The dataset correctly states the city has both.
- Richmond has both rent stabilization and just cause policies, but the interface says it has neither. The database correctly states the city has both.
- The interface says Sebastopol has rent stabilization, but an article seems to indicate it was only considering it. Sebastopol did have a temporary rent freeze, which is recorded by the dataset, but that appears to have since expired.
- Alameda is listed as having just cause protections in both the interface and dataset, but that appears to have been repealed.
- Concord, Alameda, Union City, and Fremont are listed as having rent stabilization programs. Concord, Alameda, Union City, and Fremont have rent review programs, which are voluntary non-binding mediation processes that do not guarantee limits on rent increases. When jurisdictions were surveyed in 2017 for the database, the four cities self-reported their policies as rent stabilization. Differences between rent stabilization, rent mediation, and rent arbitration ordinances are noted in the “summary/benefits” tab of the database. However, they do not preclude them from being on the “who implements” tab. Removing them from the map more than a year after they self-reported, based on a definitional change, would in effect be reteroactively changing the question the jurisdictions responded to.
Displacement Risk Areas
High-displacement risk areas are defined as American Community Survey 2009-2013 tracts where more than 39% of households are low income (below 200% of the Federal Poverty Level) and are undergoing displacement or advanced gentrification as defined as the UC Berkeley Urban Displacement Project. The table and term definitions below define the two latter terms for informational purposes.
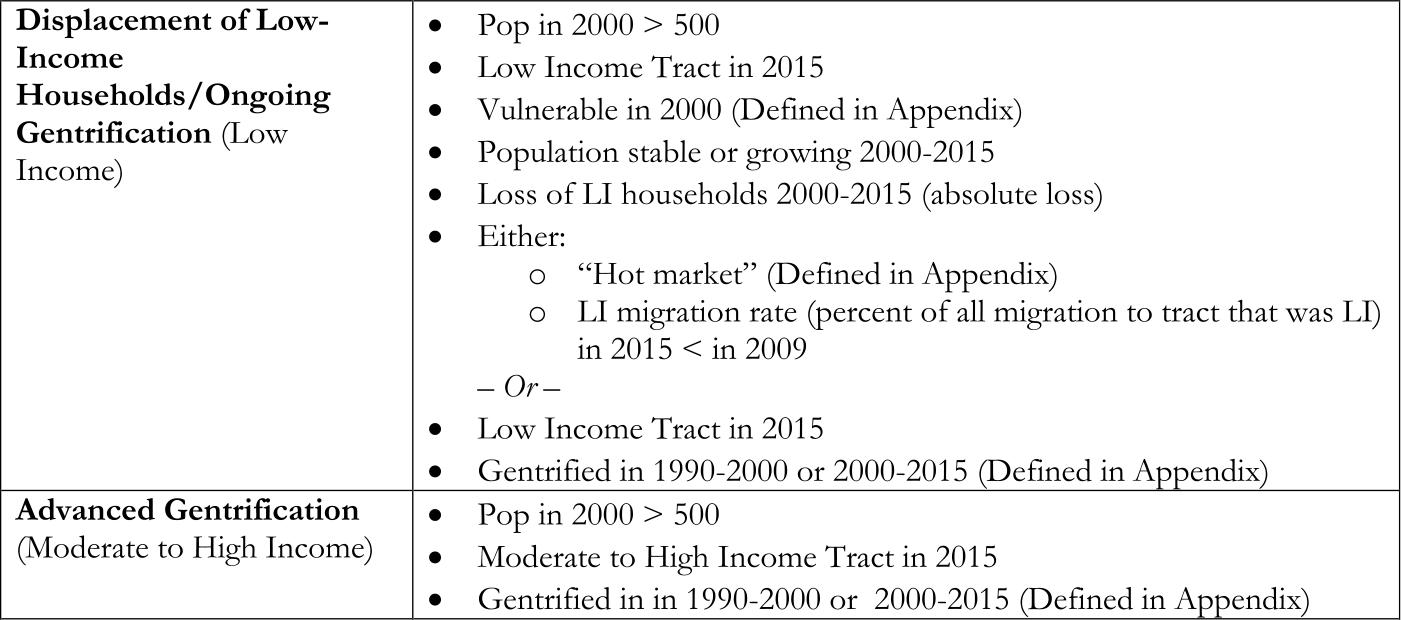
UDP Term Definitions
- Vulnerable to gentrification in 1990 or 2000 (at least 3 out of 4 of the following indicators):
- % low income households > regional median
- % college educated < regional median
- % renters > regional median
- $ nonwhite > regional median
- “Hot Market” in 2000 or 2015
- Change in median real rent > regional median or
- Change in median value for owner-occupied homes > regional median
- Gentrification from 1990 to 2000 or 2000 to 2015
- Vulnerable in base year (as defined above)
- Demographic change between base and end years (at least 2 of 3 occurring):
- Growth in % college educated > regional median
- Growth in real median household income (percent change) > regional median
- Lost low-income households
- LI migration rate (percent of all migration to tract that was LI) in 2015 < in 2009 (only used for 2000-2015 time frame)
- “Hot market” (defined above)
Methodology
Sensitive Communities
To create the Sensitive Communities shapefile, the MTC Communities of Concern shapefile is intersected with the BCDC Disadvantaged Communities.
Parcels Zoned for Housing
Parcels meeting the definitions mentioned in the Analysis Parameters section were selected from the regionwide parcel shapefile. A shapefile with the outline of high-opportunity areas - areas classified as high or highest resource by the California Tax Credit Allocation Committee (to explore the methodology, see the Opportunity Mapping Methodology document) - was overlaid on top of the new parcel shapefile. To calculate the share of parcels within Opportunity Areas, Senstitive Communities, Transit Access Areas, High Displacement Areas, Project Affordability Areas, and various combinations of the these areas; parcels were converted into centroids. If a centroid fell within an analysis area, the corresponding parcel would be counted as being in the area.
Rent Increases, 2011 to 2016
The process of obtaining ACS data was performed in R and leverages the censusapi library which is documented here: CensusAPI. To explore the methodology, take a look at the Low Income Tenure Methodology.
Low Income Renters
The process of obtaining the PUMS data was performed in R. To explore the methodology, see ACS 2012-2016 PUMS Persons by Poverty Status and Minority and Housing Expense.R. To calculate the share of low income/low income minority households paying at least 30%/50% of their income on rent within High Displacement Risk Areas, High Opportunity Areas, Sensitive Communities, and Transit Access Areas; census tracts were converted into centroids. If a centroid fell within an analysis area, the corresponding tract’s entire population would be counted as in the area.
Jurisdictions with Tenant Protections
Jurisdictions were classified using binary 1 (policy) or 0 (no policy) tags for just cause, right to legal counsel, and rent stabilization policies. The tags are stored as fields in the attribute table of a Bay Area city shapefile.
Displacement Risk Areas
Displacement Risk Areas were created by first selecting UDP displacement OR advanced gentrification tracts from a displacement typology shapefile. From that subset, tracts where >=39% of households are low income were selected to get the final shapefile of Displacement Risk Areas.
Expected Outcomes
Feature classes and web layers of:
- Sensitive Communities
- Parcels zoned for housing
- Rent increases from 2011 to 2016
- Low income renters paying 30% of their income on housing
- Low income minority renters paying over 30% of their income on housing
- Low income renters paying greater than 50% of their income on housing
- Low income minority renters paying greater than 50% of their income on housing
- Jurisdictions with tenant protections
- Displacement Risk Areas
Summary tables for:
- Single-family and multi-family parcel data
- Multi-family and mixed-use parcel data
- Low income renters
- Low income minority renters
Print maps of:
- Sensitive Communities
- Parcels zoned for housing
- Rent increases from 2011 to 2016
- Low income renters paying 30% of their income on housing
- Low income minority renters paying over 30% of their income on housing
- Low income renters paying greater than 50% of their income on housing
- Low income minority renters paying greater than 50% of their income on housing
- Jurisdictions with tenant protections
- Displacement Risk Areas
All print maps other than that of Sensitive Communitities have the outlines of Sensitive Community tracts overlaid on top of the primary data.
Results
Racial Equity Analysis for the CASA Compact
Related Works
Sensitive Communities Threshold Analysis
MTC Communities of Concern