MTC Communities of Concern - American Community Survey 2012-2016 Update
| Identify census tracts within the Bay Area that are considered Communities of Concern as defined by [MTC Resolution No. 4217-Equity Framework for Plan Bay Area 2040](https://mtc.legistar.com/LegislationDetail.aspx?ID=2555452&GUID=575A6D3F-B8B8-44CF-9F2D-ABEF8B3C9F06&Options=ID | Text | &Search=%22communities+of+concern%22) |
Project Management
Table of Contents
Data Sources
Analysis Parameters
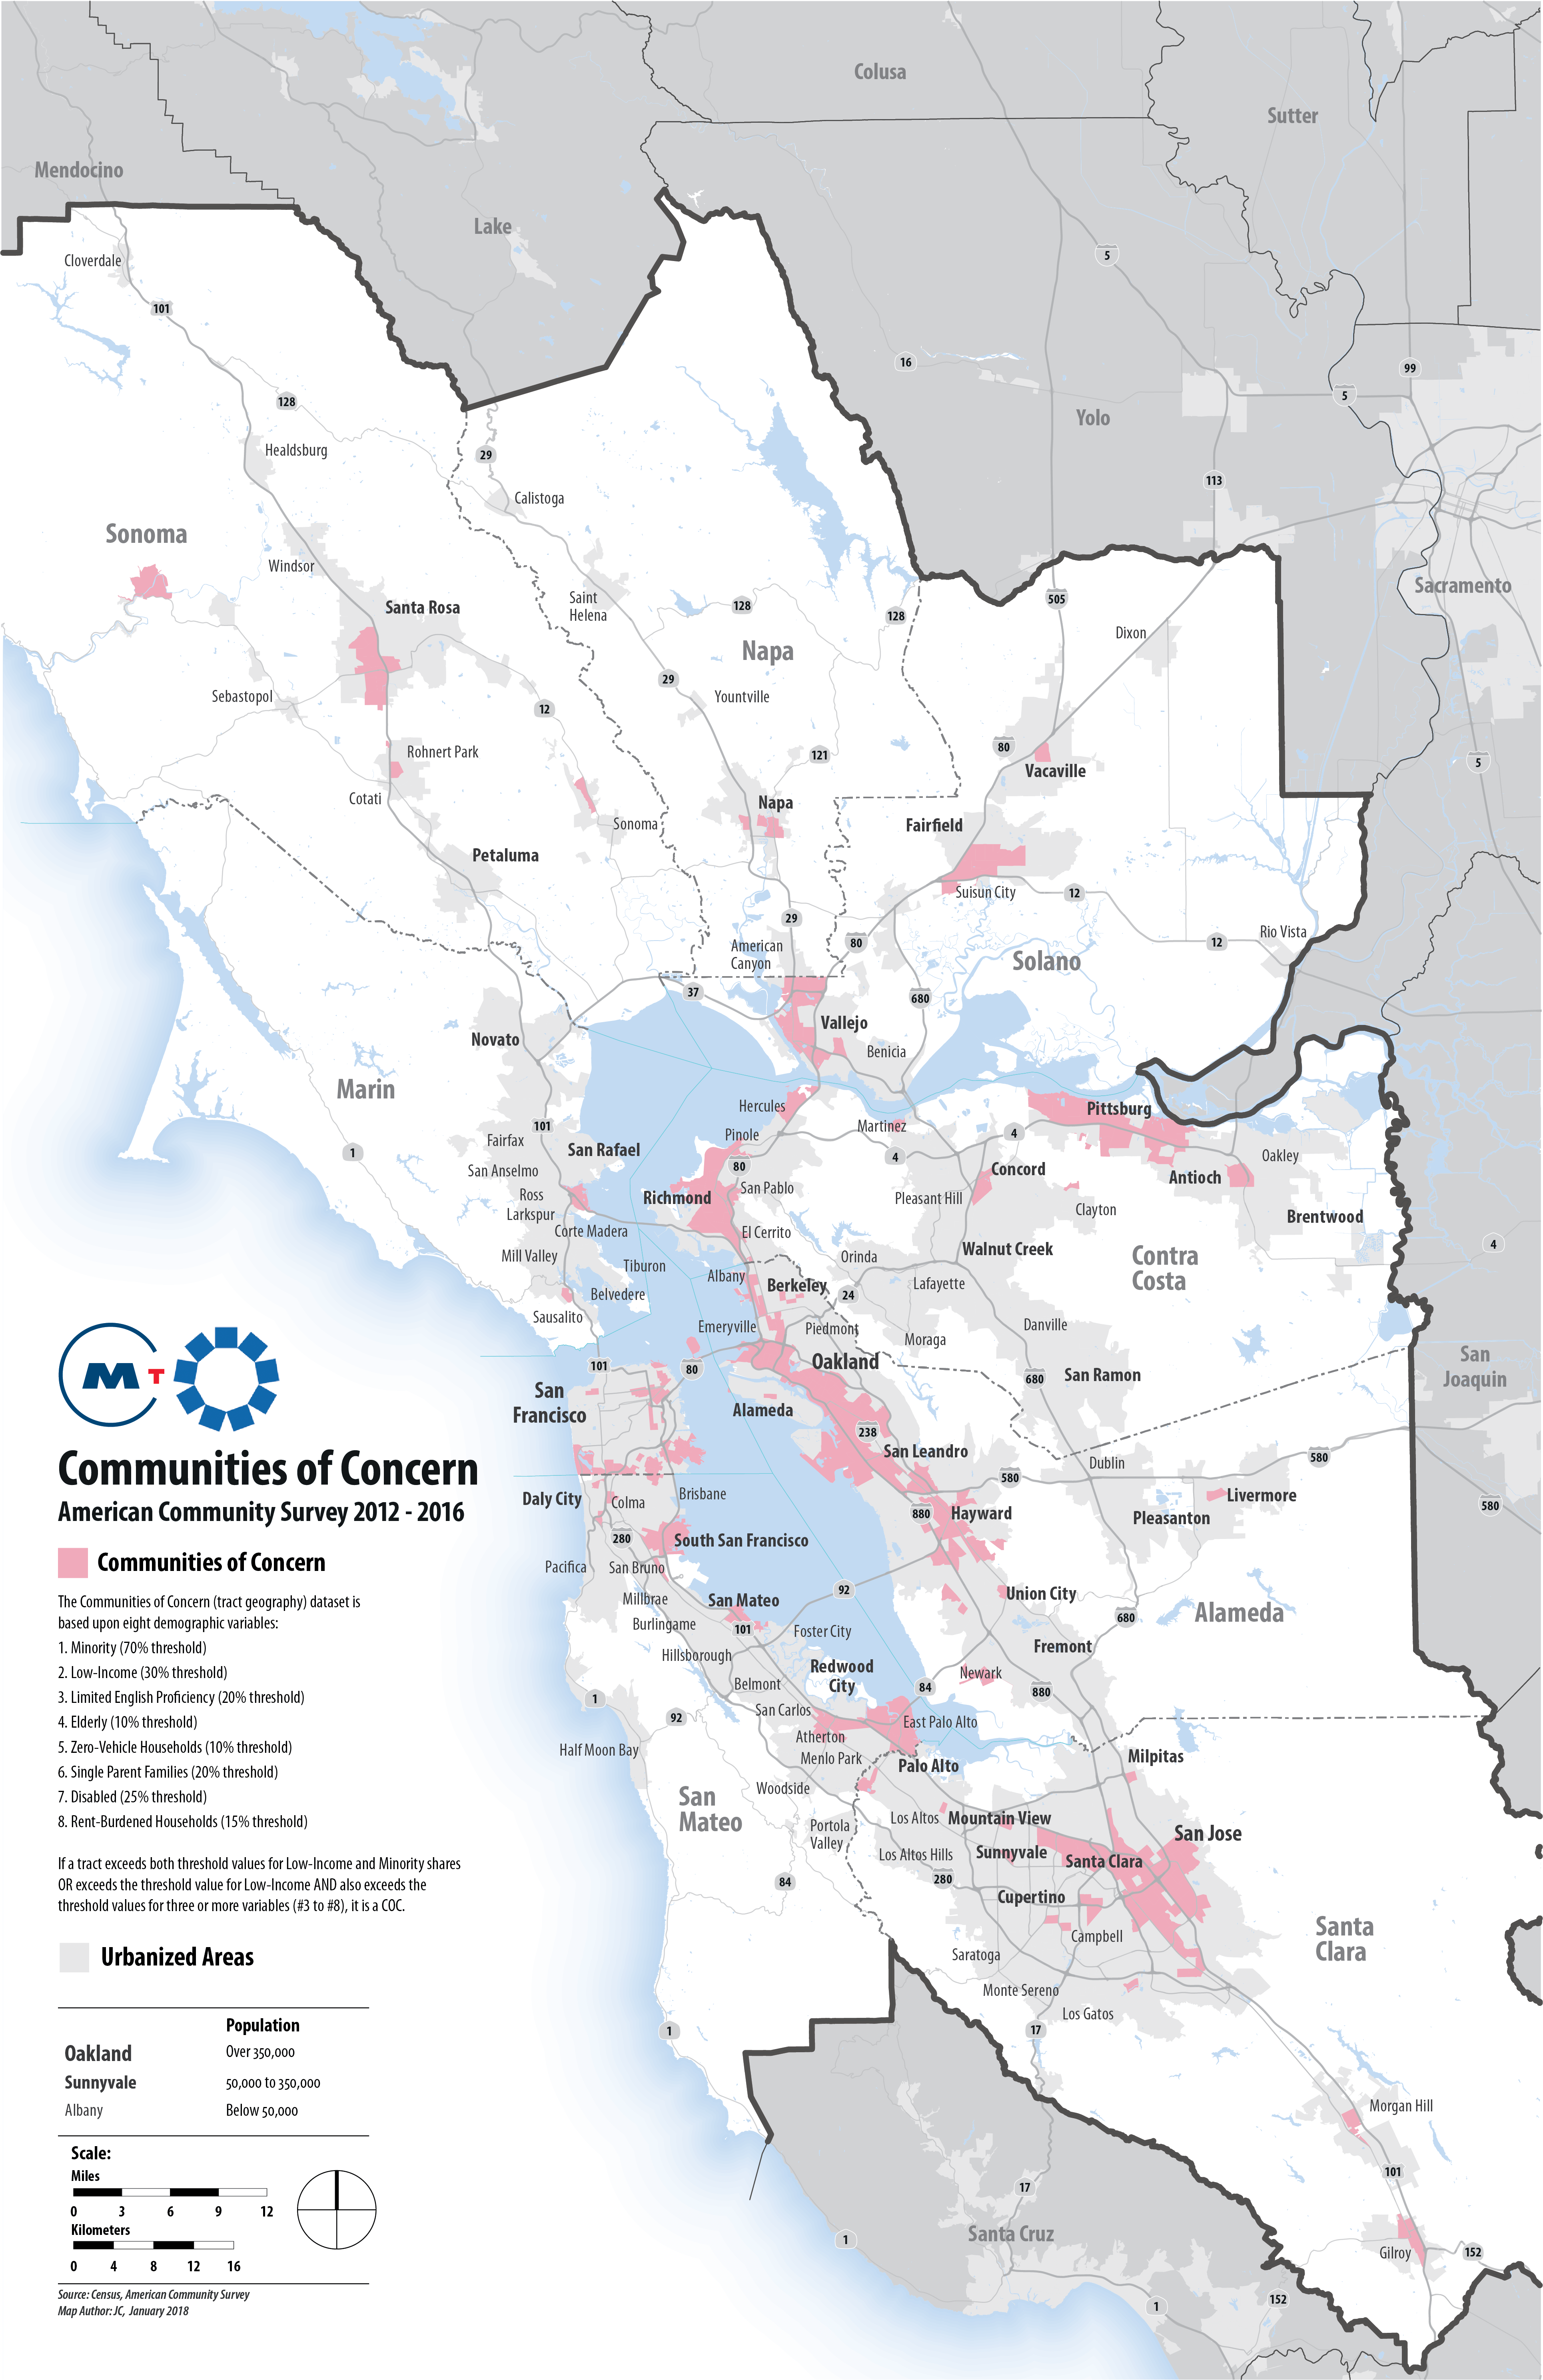
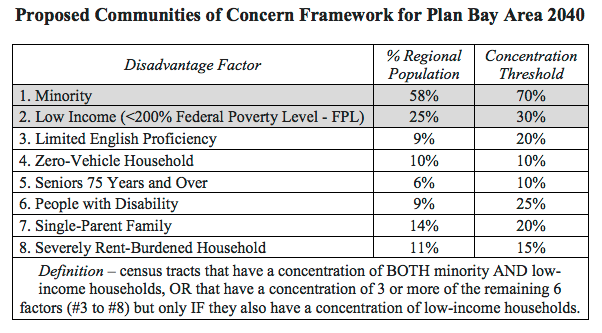
The 2018 update of MTC’s Communities of Concern follows the Adopted Communities of Concern (COC) Framework for Plan Bay Area 2040, and is based on on 2012-2016 American Community Survey (ACS) 5-year tract level data. The MTC COC Framework is provided below as well as a summary table which provides the 8 COC disadvantage factors, definitions of disadvantage factors, census-tract concentration thresholds, relevant ACS table variables, and ACS variable definitions.
MTC Communities of Concern Framework
-
[MTC Resolution No. 4217-Equity Framework for Plan Bay Area 2040](https://mtc.legistar.com/LegislationDetail.aspx?ID=2555452&GUID=575A6D3F-B8B8-44CF-9F2D-ABEF8B3C9F06&Options=ID Text &Search=%22communities+of+concern%22) - Plan Bay Area 2040-Equity Report
Communities of Concern Framework 2018 COC Update
| Disadvantage Factor | Mean of Tract-Level Shares | Standard Deviation | .5 Standard Deviation Concentration Threshold (High COC) | 1 Standard Deviation (Higher COC) | 1.5 Standard Deviation (Highest COC) |
|---|---|---|---|---|---|
| Minority | 58% | 24% | 70% | 81% | 93% |
| Low Income (<200% Federal Poverty Level -FPL) | 24% | 16% | 32% | 40% | 48% |
| Limited English Proficienty | 8% | 8% | 12% | 16% | 20% |
| Zero-Vehicle Household | 9% | 12% | 16% | 22% | 28% |
| Seniors 75 Years and Over | 6% | 4% | 8% | 11% | 13% |
| People with Disability | 10% | 4% | 12% | 14% | 16% |
| Single-Parent Family | 13% | 9% | 18% | 23% | 27% |
| Severely-Rent Burdened Household | 11% | 8% | 15% | 19% | 23% |
Definition-census tracts that have a cocentration of BOTH minority AND low-income households, OR that have a concentration of 3 or more of the remaining 6 factors (#3 to #8) but only IF they also have a concentration of low-income households.
Summary of MTC COC Disadvantage Factors & Disadvantage Factor Definitions
ACS Table Variables and MTC COC Disadvantage Factors Lookup
| Disadvantage Factor | Disadvantage Factor Definition | Concentration Threshold |
|---|---|---|
| Minority | Minority populations include persons who identify as any of the following groups as defined by the Census Bureau in accordance with guidelines provided by the U.S. Office of Management and Budget: American Indian or Alaska Native Alone (non-Hispanic/non-Latino); Asian Alone (non-Hispanic/non-Latino); Pacific Islander Alone (non-Hispanic/non-Latino); Black or African-American Alone (non-Hispanic/non-Latino); and Other (Some Other Race, Two or More Races, non-Hispanic/non-Latino); and all Hispanic/Latino persons. | 70% |
| Low Income (< 200% Federal Poverty Level -FPL) | Person living in a household with incomes less than 200% of the federal poverty level established by the Census Bureau. | 32% |
| Limited English Proficienty | Person above the age of 5 years, who do not speak English at least “well” as their primary language or had a limited ability to read, speak, write, or understand English at least “well”, as defined by the U.S. Census. | 12% |
| Zero-Vehicle Household | Households that do not own a personal vehicle. | 16% |
| Seniors 75 Years and Over | Self-explanatory. | 8% |
| People with Disability | The U.S. Census Bureau defines disability as: Hearing difficulty- deaf or having serious difficulty hearing (DEAR); Vision difficulty- blind or having serious difficulty remembering, concentrating, or making decisions (DREM); Ambulatory difficulty- having serious difficulty walking or climbing stars (DPHY; Self-care difficulty- having difficulty bathing or dressing (DDRS); Independent living difficulty- because of a physical, mental, or emotional problem, having difficulty doing errands alone such as visiting a doctor’s office or shopping (DOUT). | 12% |
| Single-Parent Family | Families with at least one child. To determine whether or not single-parent families exceed tract concentration thresholds, the share of single parent families is calculated as a share of all families regardless of whether or not they have any children. | 18% |
| Severely Rent-Burdened Household | Renters paying > 50% of income in rent. To determine whether or not severely rent-burdened households exceed tract concentration thresholds, the share of severely rent-burdened households is calculated as a share of all households regardless of occupancy status (renter or owner). | 15% |
Calculate MTC COC Disadvantage Factor Population from ACS Variable Populations
The table below provides the calculations that need to be performed to get Disadvantage Factor populations and Disadvantage Shares. To translate from variable to written description, please review the ACS Table Variables and MTC COC Disadvantage Factors Lookup. ACS Variables are also defined on the American Community Survey (ACS) website. To get variable definitions as well as the layout of tables without the estimates or margins of error filled in, download 2016 ACS Detailed Table Shells as an Excel spreadsheet.
The link below provides the COC schema and domains, along with calculations and written descriptions of the calculations which may be helpful for analysis purposes. Below the link is a table for informational purposes.
COC Schema With Field Descriptions, Population & Share Calculations
| Disadvantage Factor | Disadvantage Factor Population Based on ACS Variable Population | Disadvantage Factor Population as a Share of Universe (Population, Households, Families) | |————————————————|——————————————————————————————————————————————————————————————————————————-|——————————————————————————————————————————————————————————————————————————————–| | Minority | B03002_001E - B03002_003E | (B03002_001E -B03002_003E)/B03002_001E | | Low Income (< 200% Federal Poverty Level -FPL) | C17002_001E - C17002_008E | C17002_001E -C17002_008E/C17002_001E | | Limited English Proficienty | B16005_007E + B16005_008E + B16005_012E + B16005_013E + B16005_017E + B16005_018E + B16005_022E + B16005_023E + B16005_029E + B16005_030E + B16005_034E + B16005_035E + B16005_039E + B16005_040E + B16005_044E + B16005_045E | (B16005_007E + B16005_008E + B16005_012E + B16005_013E + B16005_017E + B16005_018E + B16005_022E + B16005_023E + B16005_029E + B16005_030E + B16005_034E + B16005_035E + B16005_039E + B16005_040E + B16005_044E +B16005_045E)/B16005_001E | | Zero-Vehicle Household | B08201_002E | B08201_002E/B08201_001E | | Seniors 75 Years and Over | B01001_023E + B01001_024E + B01001_025E + B01001_047E + B01001_048E + B01001_049E | (B01001_023E + B01001_024E + B01001_025E + B01001_047E + B01001_048E + B01001_049E)/B01001_001E | | People with Disability | C18108_001E - (C18108_005E + C18108_009E + C18108_013E) | (C18108_001E -(C18108_005E + C18108_009E + C18108_013E))/C18108_001E | | Single-Parent Family | B11004_010E + B11004_016E | (B11004_010E + B11004_016E)/B11004_001E | | Severely Rent-Burdened Household | B25070_010E | B25070_010E/B08201_001E |
Methodology
The analysis was performed in R and leverages the censusapi library which is documented here: CensusAPI
To explore the methodology, take a look at the COC Methodology
Expected Outcomes
- Feature class that contains Census Tracts meeting MTC Communities of Concern criteria
- Feature class name: ACS_2016_ALL_COC_DATA_Tracts
- Feature Class Schema
- Web layer that contains Census Tracts meeting MTC Communities of Concern criteria
- Print map of MTC Communities of Concern
Results
- 2018 Communities of Concern - ACS 2016
- 2018 Communities of Concern - ACS 2016 Geography (Urban Tracts) Web Layer